
YARN 中通过时间线服务器以通用方式存储和检索应用程序的当前和历史信息。它有两项职责
收集和检索完全特定于应用程序或框架的信息。例如,Hadoop MapReduce 框架可以包括诸如映射任务数、缩减任务数、计数器等信息。应用程序开发人员可以通过应用程序主控和/或应用程序容器中的 TimelineClient 将特定信息发布到时间线服务器。
然后可以通过 REST API 查询此信息,以便应用程序/框架特定 UI 呈现。
以前,应用程序历史服务器仅为 MapReduce 作业提供此支持。随着时间线服务器的引入,应用程序历史服务器成为时间线服务器的一种用途。
通用信息包括应用程序级别数据,例如
ApplicationSubmissionContext 中设置的用户信息等,通用数据由 YARN 资源管理器发布到时间线存储,并由其 Web UI 用于显示有关已完成应用程序的信息。
当前状态
未来计划
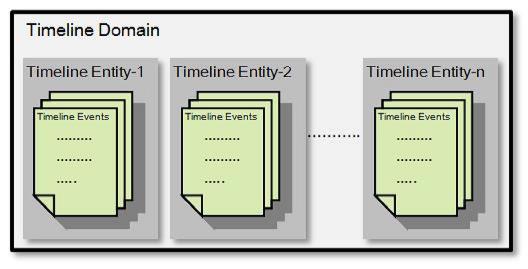
时间线域为时间线服务器提供一个命名空间,允许用户托管多个实体,将它们与其他用户和应用程序隔离。时间线服务器安全性在此级别定义。
“域”主要存储所有者信息、读和写 ACL 信息、创建和修改时间戳信息。每个域由一个 ID 标识,该 ID 在 YARN 集群中的所有用户之间必须是唯一的。
时间线实体包含概念实体及其相关事件的元信息。
该实体可以是应用程序、应用程序尝试、容器或任何用户定义的对象。
它包含主要筛选器,该筛选器将用于索引时间线存储中的实体。因此,用户/应用程序应仔细选择他们希望存储为主要筛选器的信息。
剩余数据可以存储为未编制索引的信息。每个实体都由一个 EntityId 和 EntityType 唯一标识。
时间线事件描述了一个与应用程序的特定时间线实体相关的事件。
用户可以自由定义事件的含义,例如启动应用程序、分配容器、操作失败或其他对用户和集群操作员来说相关的信息。
| 配置属性 | 说明 |
|---|---|
yarn.timeline-service.enabled |
在服务器端,它指示时间线服务是否启用。在客户端,用户可以启用它来指示客户端是否要使用时间线服务。如果在客户端启用它并启用安全,则 yarn 客户端会尝试获取时间线服务器的委派令牌。默认为 false。 |
yarn.resourcemanager.system-metrics-publisher.enabled |
控制 RM 是否在时间线服务器上发布 YARN 系统指标的设置。默认为 false。 |
yarn.timeline-service.generic-application-history.enabled |
指示客户端是否从时间线历史服务查询通用应用程序数据。如果未启用,则仅从资源管理器查询应用程序数据。默认为 false。 |
| 配置属性 | 说明 |
|---|---|
yarn.timeline-service.store-class |
时间线存储的存储类名称。默认为 org.apache.hadoop.yarn.server.timeline.LeveldbTimelineStore。 |
yarn.timeline-service.leveldb-timeline-store.path |
Leveldb 时间线存储的存储文件名。默认为 ${hadoop.tmp.dir}/yarn/timeline。 |
yarn.timeline-service.leveldb-timeline-store.ttl-interval-ms |
Leveldb 时间线存储的删除周期之间的等待时间(以毫秒为单位)。默认为 300000。 |
yarn.timeline-service.leveldb-timeline-store.read-cache-size |
Leveldb 时间线存储的未压缩块的读取缓存大小(以字节为单位)。默认为 104857600。 |
yarn.timeline-service.leveldb-timeline-store.start-time-read-cache-size |
Leveldb 时间线存储的最近读取实体开始时间的缓存大小(以实体数为单位)。默认为 10000。 |
yarn.timeline-service.leveldb-timeline-store.start-time-write-cache-size |
Leveldb 时间线存储的最近写入实体开始时间的缓存大小(以实体数为单位)。默认为 10000。 |
yarn.timeline-service.recovery.enabled |
默认为 false。 |
yarn.timeline-service.state-store-class |
时间线状态存储的存储类名称。默认为 org.apache.hadoop.yarn.server.timeline.recovery.LeveldbTimelineStateStore。 |
yarn.timeline-service.leveldb-state-store.path |
Leveldb 时间线状态存储的存储文件名。 |
| 配置属性 | 说明 |
|---|---|
yarn.timeline-service.hostname |
Timeline 服务 Web 应用程序的主机名。默认为 0.0.0.0 |
yarn.timeline-service.address |
Timeline 服务器启动 RPC 服务器的地址。默认为 ${yarn.timeline-service.hostname}:10200。 |
yarn.timeline-service.webapp.address |
Timeline 服务 Web 应用程序的 http 地址。默认为 ${yarn.timeline-service.hostname}:8188。 |
yarn.timeline-service.webapp.https.address |
Timeline 服务 Web 应用程序的 https 地址。默认为 ${yarn.timeline-service.hostname}:8190。 |
yarn.timeline-service.bind-host |
服务器将绑定的实际地址。如果设置了此可选地址,RPC 和 Webapp 服务器将绑定到此地址以及分别在 yarn.timeline-service.address 和 yarn.timeline-service.webapp.address 中指定的端口。这对于通过将设置设为 0.0.0.0 使服务侦听所有接口非常有用。 |
yarn.timeline-service.http-cross-origin.enabled |
为需要跨域 Web 响应头的 Web 服务启用跨域支持 (CORS)。例如,javascript 向 Timeline 服务器发出 Web 服务请求。默认为 false。 |
yarn.timeline-service.http-cross-origin.allowed-origins |
允许的来源的逗号分隔列表。以 regex: 为前缀的值将解释为正则表达式。也可能包含通配符 (*) 的值,这里将生成一个正则表达式,不鼓励使用,并且仅为向后兼容性提供支持。默认为 *。 |
yarn.timeline-service.http-cross-origin.allowed-methods |
需要跨域 (CORS) 支持的 Web 服务允许的方法的逗号分隔列表。默认为 GET,POST,HEAD。 |
yarn.timeline-service.http-cross-origin.allowed-headers |
需要跨域 (CORS) 支持的 Web 服务允许的标头的逗号分隔列表。默认为 X-Requested-With,Content-Type,Accept,Origin。 |
yarn.timeline-service.http-cross-origin.max-age |
需要跨域 (CORS) 支持的 Web 服务可以缓存预检请求的秒数。默认为 1800。 |
请注意,在 TimelineClient 中根据 YARN 范围配置选项 yarn.http.policy 的值来选择 HTTP 和 HTTPS 绑定;如果此策略为 HTTPS_ONLY,则将选择 HTTPS 端点。
| 配置属性 | 说明 |
|---|---|
yarn.timeline-service.ttl-enable |
启用删除 Timeline 存储中的过期数据。默认为 true。 |
yarn.timeline-service.ttl-ms |
Timeline 存储数据的生存期(以毫秒为单位)。默认为 604800000(7 天)。 |
yarn.timeline-service.handler-thread-count |
处理客户端 RPC 请求的处理程序线程数。默认为 10。 |
yarn.timeline-service.client.max-retries |
尝试将数据发布到时间线服务的最大重试次数。默认为 30。 |
yarn.timeline-service.client.retry-interval-ms |
时间线服务客户端重试之间的毫秒数间隔。默认为 1000。 |
yarn.timeline-service.generic-application-history.max-applications |
使用 REST API 或应用程序历史记录协议可以获取的最大应用程序数,并显示在时间线服务器 Web UI 中。默认为 10000。 |
如果启用,时间线服务可以托管多个 UI。该服务可以同时支持托管在目录中或捆绑的 war 文件中的静态网站。然后,Web UI 将托管在配置路径下的时间线服务 HTTP 端口上。
| 配置属性 | 说明 |
|---|---|
yarn.timeline-service.ui-names |
将托管的 UI 的逗号分隔列表。默认为 none。 |
yarn.timeline-service.ui-on-disk-path.$name |
对于每个 ui-names,应为目录服务静态内容或 Web 存档(war 文件)的位置指定一个磁盘路径。 |
yarn.timeline-service.ui-web-path.$name |
对于每个 ui-names,应相对于时间线服务器根目录指定 Web 路径。路径应以起始斜杠开头。 |
可以通过将 yarn.timeline-service.http-authentication.type 设置为 kerberos 来启用安全性,之后以下配置选项可用
| 配置属性 | 说明 |
|---|---|
yarn.timeline-service.http-authentication.type |
定义用于时间线服务器 HTTP 端点的身份验证。支持的值为:simple / kerberos / #AUTHENTICATION_HANDLER_CLASSNAME#。默认为 simple。 |
yarn.timeline-service.http-authentication.simple.anonymous.allowed |
指示在使用“简单”身份验证时,时间线服务器是否允许匿名请求。默认为 true。 |
yarn.timeline-service.principal |
时间线服务器的 Kerberos 主体。 |
yarn.timeline-service.keytab |
时间线服务器的 Kerberos 密钥表。在 Unix 上默认为 /etc/krb5.keytab。 |
yarn.timeline-service.delegation.key.update-interval |
默认为 86400000(1 天)。 |
yarn.timeline-service.delegation.token.renew-interval |
默认为 86400000(1 天)。 |
yarn.timeline-service.delegation.token.max-lifetime |
默认为 604800000(7 天)。 |
yarn.timeline-service.client.best-effort |
获取委派令牌的失败是否应被视为应用程序故障(选项 = false),或者客户端是否应尝试继续在没有令牌的情况下发布信息(选项 = true)。默认值:false |
以下是启动时间线服务器的基本配置。
<property>
  <description>Indicate to clients whether Timeline service is enabled or not.
  If enabled, the TimelineClient library used by end-users will post entities
  and events to the Timeline server.</description>
  <name>yarn.timeline-service.enabled</name>
  <value>true</value>
</property>

<property>
  <description>The setting that controls whether yarn system metrics is
  published on the timeline server or not by RM.</description>
  <name>yarn.resourcemanager.system-metrics-publisher.enabled</name>
  <value>true</value>
</property>

<property>
  <description>Indicate to clients whether to query generic application
  data from timeline history-service or not. If not enabled then application
  data is queried only from Resource Manager.</description>
  <name>yarn.timeline-service.generic-application-history.enabled</name>
  <value>true</value>
</property>
假设所有上述配置都设置正确,管理员可以使用以下命令启动时间线服务器/历史记录服务
yarn timelineserver
要以守护程序身份启动时间线服务器/历史记录服务,命令为
$HADOOP_YARN_HOME/sbin/yarn-daemon.sh start timelineserver
用户可以通过以下命令行访问应用程序的通用历史数据
$ yarn application -status <Application ID>
$ yarn applicationattempt -list <Application ID>
$ yarn applicationattempt -status <Application Attempt ID>
$ yarn container -list <Application Attempt ID>
$ yarn container -status <Container ID>
请注意,可以使用相同的命令来获取有关正在运行的应用程序的相应信息。
开发人员可以通过构建 TimelineEntity 和 TimelineEvent 对象,然后通过 TimelineClient API 将实体和事件发布到时间线服务器,来定义他们希望为其应用程序记录哪些信息。
以下是一个示例
// Create and start the Timeline client
TimelineClient client = TimelineClient.createTimelineClient();
client.init(conf);
client.start();

try {
  TimelineDomain myDomain = new TimelineDomain();
  myDomain.setId("MyDomain");
  // Compose other Domain info ....

  client.putDomain(myDomain);

  TimelineEntity myEntity = new TimelineEntity();
  myEntity.setDomainId(myDomain.getId());
  myEntity.setEntityType("APPLICATION");
  myEntity.setEntityId("MyApp1");
  // Compose other entity info

  TimelinePutResponse response = client.putEntities(entity);

  TimelineEvent event = new TimelineEvent();
  event.setEventType("APP_FINISHED");
  event.setTimestamp(System.currentTimeMillis());
  event.addEventInfo("Exit Status", "SUCCESS");
  // Compose other Event info ....

  myEntity.addEvent(event);
  TimelinePutResponse response = timelineClient.putEntities(entity);

} catch (IOException e) {
  // Handle the exception
} catch (RuntimeException e) {
  // In Hadoop 2.6, if attempts submit information to the Timeline Server fail more than the retry limit,
  // a RuntimeException will be raised. This may change in future releases, being
  // replaced with a IOException that is (or wraps) that which triggered retry failures.
} catch (YarnException e) {
  // Handle the exception
} finally {
  // Stop the Timeline client
  client.stop();
}
TimelineClient 实现类是 YARN Service API 的子类;它可以放在 CompositeService 下,以简化其生命周期管理。putEntities() 调用的结果是 TimelinePutResponse 对象。它包含时间线服务器拒绝的那些时间线实体的(希望是空的)列表,以及指示每个故障原因的错误代码。在 Hadoop 2.6 和 2.7 中,错误代码为
| 错误代码 | 说明 |
|---|---|
| 1 | 没有开始时间 |
| 2 | IOException |
| 3 | 系统过滤器冲突(使用了保留的过滤器键) |
| 4 | 访问被拒绝 |
| 5 | 没有域 |
| 6 | 禁止关系 |
将来可能会定义更多错误代码。
注意:以下是更新实体时需要观察的要点。
用户可以通过 Web UI 访问应用程序的通用历史信息
http(s)://<timeline server http(s) address:port>/applicationhistory
当前仅通过 REST API 调用支持查询时间线服务器;YARN 库中未实现 API 客户端。在 Java 中,Jersey 客户端可有效查询服务器,即使在安全模式下(前提是调用方具有适当的 Kerberos 令牌或密钥表)。
v1 REST API 在时间线服务器 Web 服务的路径 /ws/v1/timeline/ 下实现。
以下是 API 的非规范性说明。
GET /ws/v1/timeline/
返回描述服务器实例和版本信息的 JSON 对象。
 {
   About: "Timeline API",
   timeline-service-version: "3.0.0-SNAPSHOT",
   timeline-service-build-version: "3.0.0-SNAPSHOT from fcd0702c10ce574b887280476aba63d6682d5271 by zshen source checksum e9ec74ea3ff7bc9f3d35e9cac694fb",
   timeline-service-version-built-on: "2015-05-13T19:45Z",
   hadoop-version: "3.0.0-SNAPSHOT",
   hadoop-build-version: "3.0.0-SNAPSHOT from fcd0702c10ce574b887280476aba63d6682d5271 by zshen source checksum 95874b192923b43cdb96a6e483afd60",
   hadoop-version-built-on: "2015-05-13T19:44Z"
 }
/ws/v1/timeline/domain/ws/v1/timeline/domainGET /ws/v1/timeline/domain?owner=$OWNER
以 JSON 编组的 TimelineDomains 数据结构返回属于特定用户的域列表。
未经身份验证的 GET 必须设置 owner。
在经过身份验证的请求中,owner 默认为调用方。
PUT /ws/v1/timeline/domain
将序列化的 TimelineDomain 结构 PUT 到此路径将把该域添加到指定/当前用户拥有的域列表中。成功操作返回状态代码 200 和不包含任何错误的 TimelinePutResponse。
/ws/v1/timeline/domain/{domainId}返回描述域的 JSON 编组 TimelineDomain 结构。
如果未找到该域,则返回 HTTP 404 响应。
/ws/v1/timeline/domain创建新时间线域或覆盖现有域。
尝试创建新域时,提交中的 ID 在群集中的所有域中必须是唯一的。
尝试更新现有域时,必须设置该域的 ID。提交者必须具有更新该域的适当权限。
提交:TimelineDomain
响应:TimelinePutResponse
/ws/v1/timeline/domain检索用户的全部域列表。
如果指定了所有者,该所有者名称将覆盖调用者的名称。
| 查询参数 | 说明 |
|---|---|
所有者 |
要列出的域的所有者 |
GET https://:8188/ws/v1/timeline/domain?owner=alice

{
"domains":
  [
    {
    "id":"DS_DOMAIN_2",
    "owner":"alice",
    "readers":"peter",
    "writers":"john",
    "createdtime":1430425000337,
    "modifiedtime":1430425000337
    },
    {
    "id":"DS_DOMAIN_1",
    "owner":"alice",
    "readers":"bar",
    "writers":"foo",
    "createdtime":1430424955963,
    "modifiedtime":1430424955963
    }
    ,
    {"id":"DEFAULT",
    "description":"System Default Domain",
    "owner":"alice",
    "readers":"*",
    "writers":"*",
    "createdtime":1430424022699,
    "modifiedtime":1430424022699
    }
  ]
}
响应:TimelineDomains
如果用户没有列出指定所有者域的权限,则返回不包含域列表的TimelineDomains响应。
/ws/v1/timeline/domain/{domainId}检索单个域的详细信息
GET https://:8188/ws/v1/timeline/domain/DS_DOMAIN_1
响应:TimelineDomain
{
  "id":"DS_DOMAIN_1",
  "owner":"zshen",
  "readers":"bar",
  "writers":"foo",
  "createdtime":1430424955963,
  "modifiedtime":1430424955963
}
如果用户没有查询该域详细信息的权限,则返回 404,未找到异常——如果不存在具有该 ID 的条目,则返回相同的响应。
使用发布实体 API,您可以将实体和事件(包含您要记录的每个框架信息)发布到时间线服务器。
http(s)://<timeline server http(s) address:port>/ws/v1/timeline
POST
无
TimelinePutResponseHTTP 请求
POST http://<timeline server http address:port>/ws/v1/timeline
请求标头
POST /ws/v1/timeline HTTP/1.1
Accept: application/json
Content-Type: application/json
Transfer-Encoding: chunked
请求正文
{
  "entities" : [ {
    "entity" : "entity id 0",
    "entitytype" : "entity type 0",
    "relatedentities" : {
      "test ref type 2" : [ "test ref id 2" ],
      "test ref type 1" : [ "test ref id 1" ]
    },
    "events" : [ {
      "timestamp" : 1395818851590,
      "eventtype" : "event type 0",
      "eventinfo" : {
        "key2" : "val2",
        "key1" : "val1"
      }
    }, {
      "timestamp" : 1395818851590,
      "eventtype" : "event type 1",
      "eventinfo" : {
        "key2" : "val2",
        "key1" : "val1"
      }
    } ],
    "primaryfilters" : {
      "pkey2" : [ "pval2" ],
      "pkey1" : [ "pval1" ]
    },
    "otherinfo" : {
      "okey2" : "oval2",
      "okey1" : "oval1"
    },
    "starttime" : 1395818851588
  }, {
    "entity" : "entity id 1",
    "entitytype" : "entity type 0",
    "relatedentities" : {
      "test ref type 2" : [ "test ref id 2" ],
      "test ref type 1" : [ "test ref id 1" ]
    },
    "events" : [ {
      "timestamp" : 1395818851590,
      "eventtype" : "event type 0",
      "eventinfo" : {
        "key2" : "val2",
        "key1" : "val1"
      }
    }, {
      "timestamp" : 1395818851590,
      "eventtype" : "event type 1",
      "eventinfo" : {
        "key2" : "val2",
        "key1" : "val1"
      }
    } ],
    "primaryfilters" : {
      "pkey2" : [ "pval2" ],
      "pkey1" : [ "pval1" ]
    },
    "otherinfo" : {
      "okey2" : "oval2",
      "okey1" : "oval1"
    },
    "starttime" : 1395818851590
  } ]
}
必需字段
实体:type 和 id。starttime 是必需的,除非实体包含一个或多个事件)。事件:type 和 timestamp。
使用时间线实体列表 API,您可以检索实体对象列表,按实体的开始时间戳降序排列。实体的开始时间戳可以是应用程序指定的某个时间戳。如果没有明确指定,则存储会将其选为实体的第一个帖子中接收到的事件的最早时间戳。
使用以下 URI 获取给定entityType的所有实体对象。
http(s)://<timeline server http(s) address:port>/ws/v1/timeline/{entityType}
GET
limit - 要返回的实体数量限制。如果为 null,则默认为 100。windowStart - 要检索的最早开始时间戳(不包括)。如果为 null,则默认为检索所有实体,直到达到限制。windowEnd - 要检索的最晚开始时间戳(包括)。如果为 null,则默认为 Long 的最大值。fromId - 如果 fromId 不为 null,则检索早于或等于指定 ID 的实体。如果未找到指定 ID 的开始时间,则将返回一个空的实体列表。如果此实体的开始时间晚于 windowEnd,则 windowEnd 参数将优先。fromTs - 如果 fromTs 不为 null,则忽略在给定时间戳之后插入到存储中的实体。用于此比较的实体插入时间戳是收到实体的第一个 put 时存储的系统时间(而不是实体的开始时间)。primaryFilter - 仅检索具有指定主过滤器的实体。如果为 null,则检索所有实体。这是一次索引检索,不会扫描与过滤器不匹配的实体。secondaryFilters - 仅检索在主过滤器或其他信息中与所有指定过滤器完全匹配的实体。这不是索引检索,因此会扫描所有实体,但仅返回与过滤器匹配的实体。EVENTS、RELATED_ENTITIES、PRIMARY_FILTERS、OTHER_INFO、LAST_EVENT_ONLY。如果字段集合包含 LAST_EVENT_ONLY 而不包含 EVENTS,则检索每个实体的最新事件。如果为 null,则检索所有字段。请注意,primaryFilter 和 secondaryFilters 参数的关键/值对的值可以是不同的数据类型,并且匹配对数据类型敏感。用户需要正确设置值格式。例如,123 和 "123" 分别表示整数和字符串。如果实体的主过滤器为字符串 "123",但参数设置为整数 123,则不会匹配该实体。类似地,true 表示布尔值,而 "true" 表示字符串。通常,值将被强制转换为特定 Java 类型,与 jackson 库解析 JSON 片段一致。
entities(时间线实体列表)对象的元素当您请求时间线实体列表时,信息将作为容器对象的集合返回。另请参阅时间线实体以了解时间线实体对象的语法。
| 项目 | 数据类型 | 说明 |
|---|---|---|
entities |
时间线实体对象数组 (JSON) | 时间线实体对象的集合 |
HTTP 请求
GET https://:8188/ws/v1/timeline/DS_APP_ATTEMPT
响应标头
HTTP/1.1 200 OK
Content-Type: application/json
Transfer-Encoding: chunked
响应正文
{
  "entities":[
  {
  "entitytype":"DS_APP_ATTEMPT",
  "entity":"appattempt_1430424020775_0004_000001",
  "events":[
    {
    "timestamp":1430425008796,
    "eventtype":"DS_APP_ATTEMPT_END",
    "eventinfo": { }
    }
    {
    "timestamp":1430425004161,
    "eventtype":"DS_APP_ATTEMPT_START",
    "eventinfo": { }
    }
  ]
  "starttime":1430425004161,
  "domain":"DS_DOMAIN_2",
  "relatedentities": { },
  "primaryfilters":
    {
    "user":["zshen"]
    },
  "otherinfo": { }
  }
  {
  "entitytype":"DS_APP_ATTEMPT",
  "entity":"appattempt_1430424020775_0003_000001",
  "starttime":1430424959169,
  "domain":"DS_DOMAIN_1",
  "events":[
    {
    "timestamp":1430424963836,
    "eventinfo": { }
     }
    {
    "timestamp":1430424959169,
    "eventinfo": { }
    }
   ]
  "relatedentities": { },
  "primaryfilters": {
    "user":["zshen"]
   },
  "otherinfo": { }
   }
  ]
}
借助时间线实体 API,您可以检索给定实体标识符的实体信息。
使用以下 URI 获取由 entityType 值和 entityId 值标识的实体对象。
http(s)://<timeline server http(s) address:port>/ws/v1/timeline/{entityType}/{entityId}
GET
EVENTS、RELATED_ENTITIES、PRIMARY_FILTERS、OTHER_INFO、LAST_EVENT_ONLY。如果字段集包含 LAST_EVENT_ONLY 且不包含 EVENTS,则会检索每个实体的最新事件。如果为 null,则检索所有字段。entity(时间线实体)对象的元素另请参阅时间线事件列表以了解时间线事件对象的语法。请注意,primaryfilters 和 otherinfo 的 value 是对象,而不是字符串。
| 项目 | 数据类型 | 说明 |
|---|---|---|
entity |
字符串 | 实体 ID |
entitytype |
字符串 | 实体类型 |
relatedentities |
映射 | 相关实体的标识符,按 entityType : [entity1, entity2, …] 映射组织 |
events |
列表 | 实体的事件 |
primaryfilters |
映射 | 实体的主要过滤器,按 key : [value1, value2, …] 映射组织 |
otherinfo |
映射 | 实体的其他信息,按 key : value 映射组织 |
starttime |
长整数 | 实体的开始时间 |
HTTP 请求
GET https://:8188/ws/v1/timeline/DS_APP_ATTEMPT/appattempt_1430424020775_0003_000001
响应标头
HTTP/1.1 200 OK
Content-Type: application/json
Transfer-Encoding: chunked
响应正文
{
  "events":[
    {
    "timestamp":1430424959169,
    "eventtype":"DS_APP_ATTEMPT_START",
    "eventinfo":  {}}],
    "entitytype":"DS_APP_ATTEMPT",
    "entity":"appattempt_1430424020775_0003_000001",
    "starttime":1430424959169,
    "domain":"DS_DOMAIN_1",
    "relatedentities":  {},
    "primaryfilters":  {
        "user":["zshen"]
        },
    "otherinfo":  {}
    }
  ]
}
借助时间线事件 API,您可以检索所有同一实体类型的一系列实体的事件对象。每个实体的事件按其时间戳降序排列。
使用以下 URI 获取给定 entityType 的事件对象。
http(s)://<timeline server http(s) address:port>/ws/v1/timeline/{entityType}/events
GET
entityId - 要检索其事件的实体 ID。如果为 null,则不会返回任何事件。多个 entityId 可以用逗号分隔的值给出。limit - 对每个实体返回的事件数量的限制。如果为 null,则默认为每个实体 100 个事件。windowStart - 如果不为 null,则仅检索晚于给定时间(不包括)的事件windowEnd - 如果不为空,则仅检索早于给定时间(包括)的事件eventType - 将返回的事件限制为给定的类型。如果为 null,则将返回所有类型的事件。可以将多个 eventTypes 指定为逗号分隔的值。events(时间线实体列表)对象的元素当您请求时间线事件列表时,信息将作为事件对象集合返回。
| 项目 | 数据类型 | 说明 |
|---|---|---|
events |
时间线事件对象数组 (JSON) | 时间线事件对象集合 |
以下是单个事件对象的元素。请注意,eventinfo 和 otherinfo 的 value 是对象,而不是字符串。
| 项目 | 数据类型 | 说明 |
|---|---|---|
eventtype |
字符串 | 事件类型 |
eventinfo |
映射 | 事件信息,以 key : value 映射组织 |
timestamp |
长整数 | 事件的时间戳 |
HTTP 请求
GET https://:8188/ws/v1/timeline/DS_APP_ATTEMPT/events?entityId=appattempt_1430424020775_0003_000001
响应标头
HTTP/1.1 200 OK
Content-Type: application/json
Transfer-Encoding: chunked
响应正文
{
"events": [
  {
  "entity":"appattempt_1430424020775_0003_000001",
  "entitytype":"DS_APP_ATTEMPT"}
  "events":[
    {
    "timestamp":1430424963836,
    "eventtype":"DS_APP_ATTEMPT_END",
    "eventinfo":{}},
    {
    "timestamp":1430424959169,
    "eventtype":"DS_APP_ATTEMPT_START",
    "eventinfo":{}}
    ],
   }
  ]
}
用户可以通过 REST API 访问应用程序的通用历史信息。
使用 about API,您可以获取包含通用历史 REST API 描述和版本信息的时间线资源。
它本质上是 YARN TimelineAbout 结构的 XML/JSON 序列化形式。
使用以下 URI 获取时间线 about 对象。
http(s)://<timeline server http(s) address:port>/ws/v1/applicationhistory/about
GET
无
about(应用程序)对象的元素| 项目 | 数据类型 | 说明 |
|---|---|---|
关于 |
字符串 | 服务的描述 |
timeline-service-version |
字符串 | 时间线服务版本 |
timeline-service-build-version |
字符串 | 时间线服务构建版本 |
timeline-service-version-built-on |
字符串 | 时间线服务构建时间 |
hadoop-version |
字符串 | Hadoop 版本 |
hadoop-build-version |
字符串 | Hadoop 构建版本 |
hadoop-version-built-on |
字符串 | Hadoop 构建时间 |
HTTP 请求
https://:8188/ws/v1/applicationhistory/about
响应标头
HTTP/1.1 200 OK
Content-Type: application/json
Transfer-Encoding: chunked
响应正文
{
  About: "Generic History Service API",
  timeline-service-version: "3.0.0-SNAPSHOT",
  timeline-service-build-version: "3.0.0-SNAPSHOT from fcd0702c10ce574b887280476aba63d6682d5271 by zshen source checksum e9ec74ea3ff7bc9f3d35e9cac694fb",
  timeline-service-version-built-on: "2015-05-13T19:45Z",
  hadoop-version: "3.0.0-SNAPSHOT",
  hadoop-build-version: "3.0.0-SNAPSHOT from fcd0702c10ce574b887280476aba63d6682d5271 by zshen source checksum 95874b192923b43cdb96a6e483afd60",
  hadoop-version-built-on: "2015-05-13T19:44Z"
}
HTTP 请求
GET https://:8188/ws/v1/applicationhistory/about
Accept: application/xml
响应标头
HTTP/1.1 200 OK
Content-Type: application/xml
Content-Length: 748
响应正文
 <?xml version="1.0" encoding="UTF-8" standalone="yes"?>
 <about>
   <About>Generic History Service API</About>
   <hadoop-build-version>3.0.0-SNAPSHOT from fcd0702c10ce574b887280476aba63d6682d5271 by zshen source checksum 95874b192923b43cdb96a6e483afd60</hadoop-build-version>
   <hadoop-version>3.0.0-SNAPSHOT</hadoop-version>
   <hadoop-version-built-on>2015-05-13T19:44Z</hadoop-version-built-on>
   <timeline-service-build-version>3.0.0-SNAPSHOT from fcd0702c10ce574b887280476aba63d6682d5271 by zshen source checksum e9ec74ea3ff7bc9f3d35e9cac694fb</timeline-service-build-version>
   <timeline-service-version>3.0.0-SNAPSHOT</timeline-service-version>
   <timeline-service-version-built-on>2015-05-13T19:45Z</timeline-service-version-built-on>
 </about>
使用应用程序列表 API,您可以获取资源集合,每个资源都代表一个应用程序。当您对此资源运行 GET 操作时,您将获得一个应用程序对象集合。
http(s)://<timeline server http(s) address:port>/ws/v1/applicationhistory/apps
GET
states - 匹配给定应用程序状态的应用程序,指定为逗号分隔的列表
finalStatus - 应用程序的最终状态 - 由应用程序本身报告
user - 用户名
queue - 队列名称
limit - 要返回的应用程序对象总数
startedTimeBegin - 起始时间从此时间开始的应用程序,指定为自纪元以来的毫秒数
startedTimeEnd - 起始时间在此时间结束的应用程序,指定为自纪元以来的毫秒数
finishedTimeBegin - 完成时间以该时间开始的应用程序,以自纪元以来的毫秒数指定
finishedTimeEnd - 完成时间以该时间结束的应用程序,以自纪元以来的毫秒数指定
applicationTypes - 与给定应用程序类型匹配的应用程序,指定为逗号分隔的列表
apps(应用程序列表)对象的元素当您请求应用程序列表时,信息将作为应用程序对象的集合返回。另请参阅 Application,了解应用程序对象的语法。
| 项目 | 数据类型 | 说明 |
|---|---|---|
app |
app 对象数组 (JSON)/零个或多个应用程序对象 (XML) | 应用程序对象的集合 |
HTTP 请求
GET http://<timeline server http address:port>/ws/v1/applicationhistory/apps
响应标头
HTTP/1.1 200 OK
Content-Type: application/json
Transfer-Encoding: chunked
响应正文
{
  "app":
  [
      {
      "appId":"application_1430424020775_0004",
      "currentAppAttemptId":"appattempt_1430424020775_0004_000001",
      "user":"zshen",
      "name":"DistributedShell",
      "queue":"default",
      "type":"YARN",
      "host":"d-69-91-129-173.dhcp4.washington.edu/69.91.129.173",
      "rpcPort":-1,
      "appState":"FINISHED",
      "progress":100.0,
      "diagnosticsInfo":"",
      "originalTrackingUrl":"N/A",
      "trackingUrl":"http://d-69-91-129-173.dhcp4.washington.edu:8088/proxy/application_1430424020775_0004/",
      "finalAppStatus":"SUCCEEDED",
      "submittedTime":1430425001004,
      "startedTime":1430425001004,
      "finishedTime":1430425008861,
      "elapsedTime":7857,
      "unmanagedApplication":"false",
      "applicationPriority":0,
      "appNodeLabelExpression":"",
      "amNodeLabelExpression":""
      },
      {
      "appId":"application_1430424020775_0003",
      "currentAppAttemptId":"appattempt_1430424020775_0003_000001",
      "user":"zshen",
      "name":"DistributedShell",
      "queue":"default",
      "type":"YARN",
      "host":"d-69-91-129-173.dhcp4.washington.edu/69.91.129.173",
      "rpcPort":-1,
      "appState":"FINISHED",
      "progress":100.0,
      "diagnosticsInfo":"",
      "originalTrackingUrl":"N/A",
      "trackingUrl":"http://d-69-91-129-173.dhcp4.washington.edu:8088/proxy/application_1430424020775_0003/",
      "finalAppStatus":"SUCCEEDED",
      "submittedTime":1430424956650,
      "startedTime":1430424956650,
      "finishedTime":1430424963907,
      "elapsedTime":7257,
      "unmanagedApplication":"false",
      "applicationPriority":0,
      "appNodeLabelExpression":"",
      "amNodeLabelExpression":""
      },
      {
      "appId":"application_1430424020775_0002",
      "currentAppAttemptId":"appattempt_1430424020775_0002_000001",
      "user":"zshen",
      "name":"DistributedShell",
      "queue":"default",
      "type":"YARN",
      "host":"d-69-91-129-173.dhcp4.washington.edu/69.91.129.173",
      "rpcPort":-1,
      "appState":"FINISHED",
      "progress":100.0,
      "diagnosticsInfo":"",
      "originalTrackingUrl":"N/A",
      "trackingUrl":"http://d-69-91-129-173.dhcp4.washington.edu:8088/proxy/application_1430424020775_0002/",
      "finalAppStatus":"SUCCEEDED",
      "submittedTime":1430424769395,
      "startedTime":1430424769395,
      "finishedTime":1430424776594,
      "elapsedTime":7199,
      "unmanagedApplication":"false",
      "applicationPriority":0,
      "appNodeLabelExpression":"",
      "amNodeLabelExpression":""
      },
      {
      "appId":"application_1430424020775_0001",
      "currentAppAttemptId":"appattempt_1430424020775_0001_000001",
      "user":"zshen",
      "name":"QuasiMonteCarlo",
      "queue":"default",
      "type":"MAPREDUCE",
      "host":"localhost",
      "rpcPort":56264,
      "appState":"FINISHED",
      "progress":100.0,
      "diagnosticsInfo":"",
      "originalTrackingUrl":"http://d-69-91-129-173.dhcp4.washington.edu:19888/jobhistory/job/job_1430424020775_0001",
      "trackingUrl":"http://d-69-91-129-173.dhcp4.washington.edu:8088/proxy/application_1430424020775_0001/",
      "finalAppStatus":"SUCCEEDED",
      "submittedTime":1430424053809,
      "startedTime":1430424072153,
      "finishedTime":1430424776594,
      "elapsedTime":18344,
      "applicationTags":"mrapplication,ta-example",
      "unmanagedApplication":"false",
      "applicationPriority":0,
      "appNodeLabelExpression":"",
      "amNodeLabelExpression":""
      }
  ]
}
HTTP 请求
GET https://:8188/ws/v1/applicationhistory/apps
响应标头
HTTP/1.1 200 OK
Content-Type: application/xml
Content-Length: 1710
响应正文
<?xml version="1.0" encoding="UTF-8" standalone="yes"?>
<apps>
  <app>
    <appId>application_1430424020775_0004</appId>
    <currentAppAttemptId>appattempt_1430424020775_0004_000001</currentAppAttemptId>
    <user>zshen</user>
    <name>DistributedShell</name>
    <queue>default</queue>
    <type>YARN</type>
    <host>d-69-91-129-173.dhcp4.washington.edu/69.91.129.173</host>
    <rpcPort>-1</rpcPort>
    <appState>FINISHED</appState>
    <progress>100.0</progress>
    <diagnosticsInfo></diagnosticsInfo>
    <originalTrackingUrl>N/A</originalTrackingUrl>
    <trackingUrl>http://d-69-91-129-173.dhcp4.washington.edu:8088/proxy/application_1430424020775_0004/</trackingUrl>
    <finalAppStatus>SUCCEEDED</finalAppStatus>
    <submittedTime>1430425001004</submittedTime>
    <startedTime>1430425001004</startedTime>
    <finishedTime>1430425008861</finishedTime>
    <elapsedTime>7857</elapsedTime>
    <unmanagedApplication>false</unmanagedApplication>
    <applicationPriority>0</applicationPriority>
    <appNodeLabelExpression></appNodeLabelExpression>
    <amNodeLabelExpression></amNodeLabelExpression>
  </app>
  <app>
    <appId>application_1430424020775_0003</appId>
    <currentAppAttemptId>appattempt_1430424020775_0003_000001</currentAppAttemptId>
    <user>zshen</user>
    <name>DistributedShell</name>
    <queue>default</queue>
    <type>YARN</type>
    <host>d-69-91-129-173.dhcp4.washington.edu/69.91.129.173</host>
    <rpcPort>-1</rpcPort>
    <appState>FINISHED</appState>
    <progress>100.0</progress>
    <diagnosticsInfo></diagnosticsInfo>
    <originalTrackingUrl>N/A</originalTrackingUrl>
    <trackingUrl>http://d-69-91-129-173.dhcp4.washington.edu:8088/proxy/application_1430424020775_0003/</trackingUrl>
    <finalAppStatus>SUCCEEDED</finalAppStatus>
    <submittedTime>1430424956650</submittedTime>
    <startedTime>1430424956650</startedTime>
    <finishedTime>1430424963907</finishedTime>
    <elapsedTime>7257</elapsedTime>
    <unmanagedApplication>false</unmanagedApplication>
    <applicationPriority>0</applicationPriority>
    <appNodeLabelExpression></appNodeLabelExpression>
    <amNodeLabelExpression></amNodeLabelExpression>
  </app>
  <app>
    <appId>application_1430424020775_0002</appId>
    <currentAppAttemptId>appattempt_1430424020775_0002_000001</currentAppAttemptId>
    <user>zshen</user>
    <name>DistributedShell</name>
    <queue>default</queue>
    <type>YARN</type>
    <host>d-69-91-129-173.dhcp4.washington.edu/69.91.129.173</host>
    <rpcPort>-1</rpcPort>
    <appState>FINISHED</appState>
    <progress>100.0</progress>
    <diagnosticsInfo></diagnosticsInfo>
    <originalTrackingUrl>N/A</originalTrackingUrl>
    <trackingUrl>http://d-69-91-129-173.dhcp4.washington.edu:8088/proxy/application_1430424020775_0002/</trackingUrl>
    <finalAppStatus>SUCCEEDED</finalAppStatus>
    <submittedTime>1430424769395</submittedTime>
    <startedTime>1430424769395</startedTime>
    <finishedTime>1430424776594</finishedTime>
    <elapsedTime>7199</elapsedTime>
    <unmanagedApplication>false</unmanagedApplication>
    <applicationPriority>0</applicationPriority>
    <appNodeLabelExpression></appNodeLabelExpression>
    <amNodeLabelExpression></amNodeLabelExpression>
  </app>
  <app>
    <appId>application_1430424020775_0001</appId>
    <currentAppAttemptId>appattempt_1430424020775_0001_000001</currentAppAttemptId>
    <user>zshen</user>
    <name>QuasiMonteCarlo</name>
    <queue>default</queue>
    <type>MAPREDUCE</type>
    <host>localhost</host>
    <rpcPort>56264</rpcPort>
    <appState>FINISHED</appState>
    <progress>100.0</progress>
    <diagnosticsInfo></diagnosticsInfo>
    <originalTrackingUrl>http://d-69-91-129-173.dhcp4.washington.edu:19888/jobhistory/job/job_1430424020775_0001</originalTrackingUrl>
    <trackingUrl>http://d-69-91-129-173.dhcp4.washington.edu:8088/proxy/application_1430424020775_0001/</trackingUrl>
    <finalAppStatus>SUCCEEDED</finalAppStatus>
    <submittedTime>1430424053809</submittedTime>
    <startedTime>1430424053809</startedTime>
    <finishedTime>1430424072153</finishedTime>
    <elapsedTime>18344</elapsedTime>
    <applicationTags>mrapplication,ta-example</applicationTags>
    <unmanagedApplication>false</unmanagedApplication>
    <applicationPriority>0</applicationPriority>
    <appNodeLabelExpression></appNodeLabelExpression>
    <amNodeLabelExpression></amNodeLabelExpression>
  </app>
</apps>
使用应用程序 API,您可以获取应用程序资源,其中包含有关在 YARN 集群上运行的特定应用程序的信息。
它本质上是 YARN ApplicationReport 结构的 XML/JSON 序列化形式。
使用以下 URI 获取由 appid 值标识的应用程序对象。
http(s)://<timeline server http(s) address:port>/ws/v1/applicationhistory/apps/{appid}
GET
无
app(应用程序)对象的元素| 项目 | 数据类型 | 说明 |
|---|---|---|
appId |
字符串 | 应用程序 ID |
user |
字符串 | 启动应用程序的用户 |
name |
字符串 | 应用程序名称 |
type |
字符串 | 应用程序类型 |
queue |
字符串 | 应用程序提交到的队列 |
appState |
字符串 | 根据 ResourceManager 的应用程序状态 - 有效值是 YarnApplicationState 枚举的成员:FINISHED、FAILED、KILLED |
finalStatus |
字符串 | 已完成的应用程序的最终状态(如果已完成) - 由应用程序本身报告 - 有效值:UNDEFINED、SUCCEEDED、FAILED、KILLED |
progress |
float | 应用程序报告的进度(以百分比表示)。长期运行的 YARN 服务可能不会在此处提供有意义的值,或将其用作实际容器计数与所需容器计数的度量标准 |
trackingUrl |
字符串 | 应用程序的 Web URL(通过 RM 代理) |
originalTrackingUrl |
字符串 | 应用程序的实际 Web URL |
diagnosticsInfo |
字符串 | 已完成应用程序的详细诊断信息 |
startedTime |
长整数 | 应用程序启动的时间(以自纪元以来的毫秒数表示) |
finishedTime |
长整数 | 应用程序完成的时间(以自纪元以来的毫秒数表示) |
elapsedTime |
长整数 | 自应用程序启动以来的经过时间(以毫秒为单位) |
allocatedMB |
int | 分配给应用程序正在运行的容器的内存总量(以 MB 为单位) |
allocatedVCores |
int | 分配给应用程序正在运行的容器的虚拟内核总量 |
currentAppAttemptId |
字符串 | 最新的应用程序尝试 ID |
host |
字符串 | ApplicationMaster 的主机 |
rpcPort |
int | ApplicationMaster 的 RPC 端口;如果未声明 IPC 服务,则为零 |
applicationTags |
字符串 | 应用程序标记。 |
unmanagedApplication |
boolean | 应用程序是否不受管理。 |
applicationPriority |
int | 提交的应用程序的优先级。 |
appNodeLabelExpression |
字符串 | 节点标签表达式,用于识别应用程序容器默认运行的节点。 |
amNodeLabelExpression |
字符串 | 节点标签表达式,用于识别应用程序 AM 容器运行的节点。 |
HTTP 请求
https://:8188/ws/v1/applicationhistory/apps/application_1430424020775_0001
响应标头
HTTP/1.1 200 OK
Content-Type: application/json
Transfer-Encoding: chunked
响应正文
{
  "appId": "application_1430424020775_0001",
  "currentAppAttemptId": "appattempt_1430424020775_0001_000001",
  "user": "zshen",
  "name": "QuasiMonteCarlo",
  "queue": "default",
  "type": "MAPREDUCE",
  "host": "localhost",
  "rpcPort": 56264,
  "appState": "FINISHED",
  "progress": 100.0,
  "diagnosticsInfo": "",
  "originalTrackingUrl": "http://d-69-91-129-173.dhcp4.washington.edu:19888/jobhistory/job/job_1430424020775_0001",
  "trackingUrl": "http://d-69-91-129-173.dhcp4.washington.edu:8088/proxy/application_1430424020775_0001/",
  "finalAppStatus": "SUCCEEDED",
  "submittedTime": 1430424053809,
  "startedTime": 1430424053809,
  "finishedTime": 1430424072153,
  "elapsedTime": 18344,
  "applicationTags": mrapplication,tag-example,
  "unmanagedApplication": "false",
  "applicationPriority": 0,
  "appNodeLabelExpression": "",
  "amNodeLabelExpression": ""
}
HTTP 请求
GET https://:8188/ws/v1/applicationhistory/apps/application_1430424020775_0001
Accept: application/xml
响应标头
HTTP/1.1 200 OK
Content-Type: application/xml
Content-Length: 873
响应正文
 <?xml version="1.0" encoding="UTF-8" standalone="yes"?>
 <app>
   <appId>application_1430424020775_0001</appId>
   <currentAppAttemptId>appattempt_1430424020775_0001_000001</currentAppAttemptId>
   <user>zshen</user>
   <name>QuasiMonteCarlo</name>
   <queue>default</queue>
   <type>MAPREDUCE</type>
   <host>localhost</host>
   <rpcPort>56264</rpcPort>
   <appState>FINISHED</appState>
   <progress>100.0</progress>
   <diagnosticsInfo></diagnosticsInfo>
   <originalTrackingUrl>http://d-69-91-129-173.dhcp4.washington.edu:19888/jobhistory/job/job_1430424020775_0001</originalTrackingUrl>
   <trackingUrl>http://d-69-91-129-173.dhcp4.washington.edu:8088/proxy/application_1430424020775_0001/</trackingUrl>
   <finalAppStatus>SUCCEEDED</finalAppStatus>
   <submittedTime>1430424053809</submittedTime>
   <startedTime>1430424053809</startedTime>
   <finishedTime>1430424072153</finishedTime>
   <elapsedTime>18344</elapsedTime>
   <applicationTags>mrapplication,ta-example</applicationTags>
   <unmanagedApplication>false</unmanagedApplication>
   <applicationPriority>0</applicationPriority>
   <appNodeLabelExpression><appNodeLabelExpression>
   <amNodeLabelExpression><amNodeLabelExpression>
 </app>
使用应用程序尝试列表 API,您可以获取资源集合,其中每个资源都代表一个应用程序尝试。当您对此资源运行 GET 操作时,您将获得应用程序尝试对象的集合。
使用以下 URI 获取由 appid 值标识的应用程序的所有尝试对象。
http(s)://<timeline server http(s) address:port>/ws/v1/applicationhistory/apps/{appid}/appattempts
GET
无
appattempts(应用程序尝试列表)对象的元素当您请求应用程序尝试列表时,信息将作为应用程序尝试对象的集合返回。有关应用程序尝试对象的语法,请参阅 应用程序尝试。
| 项目 | 数据类型 | 说明 |
|---|---|---|
appattempt |
appattempt 对象数组 (JSON)/零个或多个应用程序尝试对象 (XML) | 应用程序尝试对象的集合 |
HTTP 请求
GET https://:8188/ws/v1/applicationhistory/apps/application_1430424020775_0001/appattempts
响应标头
HTTP/1.1 200 OK
Content-Type: application/json
Transfer-Encoding: chunked
响应正文
{
  "appAttempt": [
    {
      "appAttemptId": "appattempt_1430424020775_0001_000001",
      "host": "localhost",
      "rpcPort": 56264,
      "trackingUrl": "http://d-69-91-129-173.dhcp4.washington.edu:8088/proxy/application_1430424020775_0001/",
      "originalTrackingUrl": "http://d-69-91-129-173.dhcp4.washington.edu:19888/jobhistory/job/job_1430424020775_0001",
      "diagnosticsInfo": "",
      "appAttemptState": "FINISHED",
      "amContainerId": "container_1430424020775_0001_01_000001"
    }
  ]
}
HTTP 请求
GET https://:8188/ws/v1/applicationhistory/apps/application_1430424020775_0001/appattempts
Accept: application/xml
响应标头
HTTP/1.1 200 OK
Content-Type: application/xml
响应正文
<?xml version="1.0" encoding="UTF-8" standalone="yes"?>
<appAttempts>
  <appAttempt>
    <appAttemptId>appattempt_1430424020775_0001_000001</appAttemptId>
    <host>localhost</host>
    <rpcPort>56264</rpcPort>
    <trackingUrl>http://d-69-91-129-173.dhcp4.washington.edu:8088/proxy/application_1430424020775_0001/</trackingUrl>
    <originalTrackingUrl>http://d-69-91-129-173.dhcp4.washington.edu:19888/jobhistory/job/job_1430424020775_0001</originalTrackingUrl>
    <diagnosticsInfo></diagnosticsInfo>
    <appAttemptState>FINISHED</appAttemptState>
    <amContainerId>container_1430424020775_0001_01_000001</amContainerId>
  </appAttempt>
</appAttempts>
使用应用程序尝试 API,您可以获取应用程序尝试资源,其中包含有关在 YARN 集群上运行的应用程序的特定应用程序尝试的信息。
使用以下 URI 获取由 appid 值和 appattemptid 值标识的应用程序尝试对象。
http(s)://<timeline server http(s) address:port>/ws/v1/applicationhistory/apps/{appid}/appattempts/{appattemptid}
GET
无
appattempt(应用程序尝试)对象的元素| 项目 | 数据类型 | 说明 |
|---|---|---|
appAttemptId |
字符串 | 应用程序尝试 ID |
amContainerId |
字符串 | ApplicationMaster 容器 ID |
appAttemptState |
字符串 | 根据 ResourceManager 的应用程序尝试状态 - 有效值是 YarnApplicationAttemptState 枚举的成员:FINISHED、FAILED、KILLED |
trackingUrl |
字符串 | 可用于跟踪应用程序的 Web URL |
originalTrackingUrl |
字符串 | 应用程序的实际 Web URL |
diagnosticsInfo |
字符串 | 详细的诊断信息 |
host |
字符串 | ApplicationMaster 的主机 |
rpcPort |
int | ApplicationMaster 的 RPC 端口 |
HTTP 请求
https://:8188/ws/v1/applicationhistory/apps/application_1430424020775_0001/appattempts/appattempt_1430424020775_0001_000001
响应标头
HTTP/1.1 200 OK
Content-Type: application/json
Transfer-Encoding: chunked
响应正文
{
  "appAttemptId": "appattempt_1430424020775_0001_000001",
  "host": "localhost",
  "rpcPort": 56264,
  "trackingUrl": "http://d-69-91-129-173.dhcp4.washington.edu:8088/proxy/application_1430424020775_0001/",
  "originalTrackingUrl": "http://d-69-91-129-173.dhcp4.washington.edu:19888/jobhistory/job/job_1430424020775_0001",
  "diagnosticsInfo": "",
  "appAttemptState": "FINISHED",
  "amContainerId": "container_1430424020775_0001_01_000001"
}
HTTP 请求
GET http://<timeline server http address:port>/ws/v1/applicationhistory/apps/application_1395789200506_0001/appattempts/appattempt_1395789200506_0001_000001
Accept: application/xml
响应标头
HTTP/1.1 200 OK
Content-Type: application/xml
Content-Length: 488
响应正文
<?xml version="1.0" encoding="UTF-8" standalone="yes"?>
<appAttempt>
  <appAttemptId>appattempt_1430424020775_0001_000001</appAttemptId>
  <host>localhost</host>
  <rpcPort>56264</rpcPort>
  <trackingUrl>http://d-69-91-129-173.dhcp4.washington.edu:8088/proxy/application_1430424020775_0001/</trackingUrl>
  <originalTrackingUrl>http://d-69-91-129-173.dhcp4.washington.edu:19888/jobhistory/job/job_1430424020775_0001</originalTrackingUrl>
  <diagnosticsInfo></diagnosticsInfo>
  <appAttemptState>FINISHED</appAttemptState>
  <amContainerId>container_1430424020775_0001_01_000001</amContainerId>
</appAttempt>
使用容器列表 API,您可以获取资源集合,其中每个资源都代表一个容器。当您对此资源运行 GET 操作时,您将获得容器对象的集合。
使用以下 URI 获取由 appid 值和 appattemptid 值标识的应用程序尝试的所有容器对象。
http(s)://<timeline server http(s) address:port>/ws/v1/applicationhistory/apps/{appid}/appattempts/{appattemptid}/containers
GET
无
containers(容器列表)对象的元素当您请求容器列表时,信息将作为容器对象集合返回。另请参见 Container 了解容器对象的语法。
| 项目 | 数据类型 | 说明 |
|---|---|---|
container |
容器对象数组(JSON)/零个或多个容器对象(XML) | 容器对象集合 |
HTTP 请求
GET https://:8188/ws/v1/applicationhistory/apps/application_1430424020775_0001/appattempts/appattempt_1430424020775_0001_000001/containers?
响应标头
HTTP/1.1 200 OK
Content-Type: application/json
Transfer-Encoding: chunked
响应正文
{
  "container": [
    {
      "containerId": "container_1430424020775_0001_01_000007",
      "allocatedMB": 1024,
      "allocatedVCores": 1,
      "assignedNodeId": "localhost:9105",
      "priority": 10,
      "startedTime": 1430424068296,
      "finishedTime": 1430424073006,
      "elapsedTime": 4710,
      "diagnosticsInfo": "Container killed by the ApplicationMaster.\nContainer killed on request. Exit code is 143\nContainer exited with a non-zero exit code 143\n",
      "logUrl": "http://0.0.0.0:8188/applicationhistory/logs/localhost:9105/container_1430424020775_0001_01_000007/container_1430424020775_0001_01_000007/zshen",
      "containerExitStatus": -105,
      "containerState": "COMPLETE",
      "nodeHttpAddress": "https://:8042"
    },
    {
      "containerId": "container_1430424020775_0001_01_000006",
      "allocatedMB": 1024,
      "allocatedVCores": 1,
      "assignedNodeId": "localhost:9105",
      "priority": 20,
      "startedTime": 1430424060317,
      "finishedTime": 1430424068293,
      "elapsedTime": 7976,
      "diagnosticsInfo": "Container killed by the ApplicationMaster.\nContainer killed on request. Exit code is 143\nContainer exited with a non-zero exit code 143\n",
      "logUrl": "http://0.0.0.0:8188/applicationhistory/logs/localhost:9105/container_1430424020775_0001_01_000006/container_1430424020775_0001_01_000006/zshen",
      "containerExitStatus": -105,
      "containerState": "COMPLETE",
      "nodeHttpAddress": "https://:8042"
    },
    {
      "containerId": "container_1430424020775_0001_01_000005",
      "allocatedMB": 1024,
      "allocatedVCores": 1,
      "assignedNodeId": "localhost:9105",
      "priority": 20,
      "startedTime": 1430424060316,
      "finishedTime": 1430424068294,
      "elapsedTime": 7978,
      "diagnosticsInfo": "Container killed by the ApplicationMaster.\nContainer killed on request. Exit code is 143\nContainer exited with a non-zero exit code 143\n",
      "logUrl": "http://0.0.0.0:8188/applicationhistory/logs/localhost:9105/container_1430424020775_0001_01_000005/container_1430424020775_0001_01_000005/zshen",
      "containerExitStatus": -105,
      "containerState": "COMPLETE",
      "nodeHttpAddress": "https://:8042"
    },
    {
      "containerId": "container_1430424020775_0001_01_000003",
      "allocatedMB": 1024,
      "allocatedVCores": 1,
      "assignedNodeId": "localhost:9105",
      "priority": 20,
      "startedTime": 1430424060315,
      "finishedTime": 1430424068289,
      "elapsedTime": 7974,
      "diagnosticsInfo": "Container killed by the ApplicationMaster.\nContainer killed on request. Exit code is 143\nContainer exited with a non-zero exit code 143\n",
      "logUrl": "http://0.0.0.0:8188/applicationhistory/logs/localhost:9105/container_1430424020775_0001_01_000003/container_1430424020775_0001_01_000003/zshen",
      "containerExitStatus": -105,
      "containerState": "COMPLETE",
      "nodeHttpAddress": "https://:8042"
    },
    {
      "containerId": "container_1430424020775_0001_01_000004",
      "allocatedMB": 1024,
      "allocatedVCores": 1,
      "assignedNodeId": "localhost:9105",
      "priority": 20,
      "startedTime": 1430424060315,
      "finishedTime": 1430424068291,
      "elapsedTime": 7976,
      "diagnosticsInfo": "Container killed by the ApplicationMaster.\nContainer killed on request. Exit code is 143\nContainer exited with a non-zero exit code 143\n",
      "logUrl": "http://0.0.0.0:8188/applicationhistory/logs/localhost:9105/container_1430424020775_0001_01_000004/container_1430424020775_0001_01_000004/zshen",
      "containerExitStatus": -105,
      "containerState": "COMPLETE",
      "nodeHttpAddress": "https://:8042"
    },
    {
      "containerId": "container_1430424020775_0001_01_000002",
      "allocatedMB": 1024,
      "allocatedVCores": 1,
      "assignedNodeId": "localhost:9105",
      "priority": 20,
      "startedTime": 1430424060313,
      "finishedTime": 1430424067250,
      "elapsedTime": 6937,
      "diagnosticsInfo": "Container killed by the ApplicationMaster.\nContainer killed on request. Exit code is 143\nContainer exited with a non-zero exit code 143\n",
      "logUrl": "http://0.0.0.0:8188/applicationhistory/logs/localhost:9105/container_1430424020775_0001_01_000002/container_1430424020775_0001_01_000002/zshen",
      "containerExitStatus": -105,
      "containerState": "COMPLETE",
      "nodeHttpAddress": "https://:8042"
    },
    {
      "containerId": "container_1430424020775_0001_01_000001",
      "allocatedMB": 2048,
      "allocatedVCores": 1,
      "assignedNodeId": "localhost:9105",
      "priority": 0,
      "startedTime": 1430424054314,
      "finishedTime": 1430424079022,
      "elapsedTime": 24708,
      "diagnosticsInfo": "",
      "logUrl": "http://0.0.0.0:8188/applicationhistory/logs/localhost:9105/container_1430424020775_0001_01_000001/container_1430424020775_0001_01_000001/zshen",
      "containerExitStatus": 0,
      "containerState": "COMPLETE",
      "nodeHttpAddress": "https://:8042"
    }
  ]
}
HTTP 请求
GET https://:8188/ws/v1/applicationhistory/apps/application_1430424020775_0001/appattempts/appattempt_1430424020775_0001_000001/containers
Accept: application/xml
响应标头
  HTTP/1.1 200 OK
  Content-Type: application/xml
  Content-Length: 1428
响应正文
<?xml version="1.0" encoding="UTF-8" standalone="yes"?>
<containers>
  <container>
    <containerId>container_1430424020775_0001_01_000007</containerId>
    <allocatedMB>1024</allocatedMB>
    <allocatedVCores>1</allocatedVCores>
    <assignedNodeId>localhost:9105</assignedNodeId>
    <priority>10</priority>
    <startedTime>1430424068296</startedTime>
    <finishedTime>1430424073006</finishedTime>
    <elapsedTime>4710</elapsedTime>
    <diagnosticsInfo>Container killed by the ApplicationMaster.
      Container killed on request. Exit code is 143
      Container exited with a non-zero exit code 143
    </diagnosticsInfo>
    <logUrl>http://0.0.0.0:8188/applicationhistory/logs/localhost:9105/container_1430424020775_0001_01_000007/container_1430424020775_0001_01_000007/zshen</logUrl>
    <containerExitStatus>-105</containerExitStatus>
    <containerState>COMPLETE</containerState>
    <nodeHttpAddress>https://:8042</nodeHttpAddress>
  </container>
  <container>
    <containerId>container_1430424020775_0001_01_000006</containerId>
    <allocatedMB>1024</allocatedMB>
    <allocatedVCores>1</allocatedVCores>
    <assignedNodeId>localhost:9105</assignedNodeId>
    <priority>20</priority>
    <startedTime>1430424060317</startedTime>
    <finishedTime>1430424068293</finishedTime>
    <elapsedTime>7976</elapsedTime>
    <diagnosticsInfo>Container killed by the ApplicationMaster.
      Container killed on request. Exit code is 143
      Container exited with a non-zero exit code 143
    </diagnosticsInfo>
    <logUrl>http://0.0.0.0:8188/applicationhistory/logs/localhost:9105/container_1430424020775_0001_01_000006/container_1430424020775_0001_01_000006/zshen</logUrl>
    <containerExitStatus>-105</containerExitStatus>
    <containerState>COMPLETE</containerState>
    <nodeHttpAddress>https://:8042</nodeHttpAddress>
  </container>
  <container>
    <containerId>container_1430424020775_0001_01_000005</containerId>
    <allocatedMB>1024</allocatedMB>
    <allocatedVCores>1</allocatedVCores>
    <assignedNodeId>localhost:9105</assignedNodeId>
    <priority>20</priority>
    <startedTime>1430424060316</startedTime>
    <finishedTime>1430424068294</finishedTime>
    <elapsedTime>7978</elapsedTime>
    <diagnosticsInfo>Container killed by the ApplicationMaster.
      Container killed on request. Exit code is 143
      Container exited with a non-zero exit code 143
    </diagnosticsInfo>
    <logUrl>http://0.0.0.0:8188/applicationhistory/logs/localhost:9105/container_1430424020775_0001_01_000005/container_1430424020775_0001_01_000005/zshen</logUrl>
    <containerExitStatus>-105</containerExitStatus>
    <containerState>COMPLETE</containerState>
    <nodeHttpAddress>https://:8042</nodeHttpAddress>
  </container>
  <container>
    <containerId>container_1430424020775_0001_01_000003</containerId>
    <allocatedMB>1024</allocatedMB>
    <allocatedVCores>1</allocatedVCores>
    <assignedNodeId>localhost:9105</assignedNodeId>
    <priority>20</priority>
    <startedTime>1430424060315</startedTime>
    <finishedTime>1430424068289</finishedTime>
    <elapsedTime>7974</elapsedTime>
    <diagnosticsInfo>Container killed by the ApplicationMaster.
      Container killed on request. Exit code is 143
      Container exited with a non-zero exit code 143
    </diagnosticsInfo>
    <logUrl>http://0.0.0.0:8188/applicationhistory/logs/localhost:9105/container_1430424020775_0001_01_000003/container_1430424020775_0001_01_000003/zshen</logUrl>
    <containerExitStatus>-105</containerExitStatus>
    <containerState>COMPLETE</containerState>
    <nodeHttpAddress>https://:8042</nodeHttpAddress>
  </container>
  <container>
    <containerId>container_1430424020775_0001_01_000004</containerId>
    <allocatedMB>1024</allocatedMB>
    <allocatedVCores>1</allocatedVCores>
    <assignedNodeId>localhost:9105</assignedNodeId>
    <priority>20</priority>
    <startedTime>1430424060315</startedTime>
    <finishedTime>1430424068291</finishedTime>
    <elapsedTime>7976</elapsedTime>
    <diagnosticsInfo>Container killed by the ApplicationMaster.
      Container killed on request. Exit code is 143
      Container exited with a non-zero exit code 143
    </diagnosticsInfo>
    <logUrl>http://0.0.0.0:8188/applicationhistory/logs/localhost:9105/container_1430424020775_0001_01_000004/container_1430424020775_0001_01_000004/zshen</logUrl>
    <containerExitStatus>-105</containerExitStatus>
    <containerState>COMPLETE</containerState>
    <nodeHttpAddress>https://:8042</nodeHttpAddress>
  </container>
  <container>
    <containerId>container_1430424020775_0001_01_000002</containerId>
    <allocatedMB>1024</allocatedMB>
    <allocatedVCores>1</allocatedVCores>
    <assignedNodeId>localhost:9105</assignedNodeId>
    <priority>20</priority>
    <startedTime>1430424060313</startedTime>
    <finishedTime>1430424067250</finishedTime>
    <elapsedTime>6937</elapsedTime>
    <diagnosticsInfo>Container killed by the ApplicationMaster.
      Container killed on request. Exit code is 143
      Container exited with a non-zero exit code 143
    </diagnosticsInfo>
    <logUrl>http://0.0.0.0:8188/applicationhistory/logs/localhost:9105/container_1430424020775_0001_01_000002/container_1430424020775_0001_01_000002/zshen</logUrl>
    <containerExitStatus>-105</containerExitStatus>
    <containerState>COMPLETE</containerState>
    <nodeHttpAddress>https://:8042</nodeHttpAddress>
  </container>
  <container>
    <containerId>container_1430424020775_0001_01_000001</containerId>
    <allocatedMB>2048</allocatedMB>
    <allocatedVCores>1</allocatedVCores>
    <assignedNodeId>localhost:9105</assignedNodeId>
    <priority>0</priority>
    <startedTime>1430424054314</startedTime>
    <finishedTime>1430424079022</finishedTime>
    <elapsedTime>24708</elapsedTime>
    <diagnosticsInfo></diagnosticsInfo>
    <logUrl>http://0.0.0.0:8188/applicationhistory/logs/localhost:9105/container_1430424020775_0001_01_000001/container_1430424020775_0001_01_000001/zshen</logUrl>
    <containerExitStatus>0</containerExitStatus>
    <containerState>COMPLETE</containerState>
    <nodeHttpAddress>https://:8042</nodeHttpAddress>
  </container>
</containers>
使用容器 API,您可以获取一个容器资源,其中包含有关在 YARN 集群上运行的应用程序的应用程序尝试的特定容器的信息。
使用以下 URI 获取由 appid 值、appattemptid 值和 containerid 值标识的容器对象。
http(s)://<timeline server http(s) address:port>/ws/v1/applicationhistory/apps/{appid}/appattempts/{appattemptid}/containers/{containerid}
GET
无
container(容器)对象的元素| 项目 | 数据类型 | 说明 |
|---|---|---|
containerId |
字符串 | 容器 ID |
containerState |
字符串 | 根据 ResourceManager 的容器状态 - 有效值是 ContainerState 枚举的成员:COMPLETE |
containerExitStatus |
int | 容器退出状态 |
logUrl |
字符串 | 可用于访问容器聚合日志的日志 URL |
diagnosticsInfo |
字符串 | 详细的诊断信息 |
startedTime |
长整数 | 容器启动的时间(自纪元以来的毫秒数) |
finishedTime |
长整数 | 容器完成的时间(自纪元以来的毫秒数) |
elapsedTime |
长整数 | 自容器启动以来的经过时间(以毫秒为单位) |
allocatedMB |
int | 分配给容器的内存(以 MB 为单位) |
allocatedVCores |
int | 分配给容器的虚拟内核 |
priority |
int | 容器的优先级 |
assignedNodeId |
字符串 | 容器的已分配节点主机和端口 |
HTTP 请求
GET https://:8188/ws/v1/applicationhistory/apps/application_1430424020775_0001/appattempts/appattempt_1430424020775_0001_000001/containers/container_1430424020775_0001_01_000001
响应标头
HTTP/1.1 200 OK
Content-Type: application/json
Transfer-Encoding: chunked
响应正文
{
  "containerId": "container_1430424020775_0001_01_000001",
  "allocatedMB": 2048,
  "allocatedVCores": 1,
  "assignedNodeId": "localhost:9105",
  "priority": 0,
  "startedTime": 1430424054314,
  "finishedTime": 1430424079022,
  "elapsedTime": 24708,
  "diagnosticsInfo": "",
  "logUrl": "http://0.0.0.0:8188/applicationhistory/logs/localhost:9105/container_1430424020775_0001_01_000001/container_1430424020775_0001_01_000001/zshen",
  "containerExitStatus": 0,
  "containerState": "COMPLETE",
  "nodeHttpAddress": "https://:8042"
}
HTTP 请求
GET https://:8188/ws/v1/applicationhistory/apps/application_1430424020775_0001/appattempts/appattempt_1430424020775_0001_000001/containers/container_1430424020775_0001_01_000001
Accept: application/xml
响应标头
HTTP/1.1 200 OK
Content-Type: application/xml
Content-Length: 669
响应正文
<?xml version="1.0" encoding="UTF-8" standalone="yes"?>
<container>
  <containerId>container_1430424020775_0001_01_000001</containerId>
  <allocatedMB>2048</allocatedMB>
  <allocatedVCores>1</allocatedVCores>
  <assignedNodeId>localhost:9105</assignedNodeId>
  <priority>0</priority>
  <startedTime>1430424054314</startedTime>
  <finishedTime>1430424079022</finishedTime>
  <elapsedTime>24708</elapsedTime>
  <diagnosticsInfo></diagnosticsInfo>
  <logUrl>http://0.0.0.0:8188/applicationhistory/logs/localhost:9105/container_1430424020775_0001_01_000001/container_1430424020775_0001_01_000001/zshen</logUrl>
  <containerExitStatus>0</containerExitStatus>
  <containerState>COMPLETE</containerState>
  <nodeHttpAddress>https://:8042</nodeHttpAddress>
</container>
时间线服务器性能测试工具有助于衡量时间线服务器的写入性能。该测试启动 SimpleEntityWriter 映射器或 JobHistoryFileReplay 映射器,以将时间线实体写入时间线服务器。最后,将衡量和打印出每个映射器的交易率 (ops/s) 和总交易率。使用 SimpleEntityWriter 映射器运行测试还将衡量和显示每个映射器的 IO 率 (KB/s) 和总 IO 率。
映射器类型说明
选项
[-m <maps>] number of mappers (default: 1)
[-v] timeline service version
[-mtype <mapper type in integer>]
      1. simple entity write mapper (default)
      2. jobhistory files replay mapper
[-s <(KBs)test>] number of KB per put (mtype=1, default: 1 KB)
[-t] package sending iterations per mapper (mtype=1, default: 100)
[-d <path>] root path of job history files (mtype=2)
[-r <replay mode>] (mtype=2)
      1. write all entities for a job in one put (default)
      2. write one entity at a time
运行 SimpleEntityWriter 测试
bin/hadoop jar performanceTest.jar timelineperformance -m 4 -mtype 1 -s 3 -t 200
SimpleEntityWriter 测试的示例输出
TRANSACTION RATE (per mapper): 20000.0 ops/s
IO RATE (per mapper): 60000.0 KB/s
TRANSACTION RATE (total): 80000.0 ops/s
IO RATE (total): 240000.0 KB/s
运行 JobHistoryFileReplay 映射器测试
$ bin/hadoop jar performanceTest.jar timelineperformance -m 2 -mtype 2 -d /testInput -r 2
JobHistoryFileReplay 映射器测试的示例输入
$ bin/hadoop fs -ls /testInput
/testInput/job_1.jhist
/testInput/job_1_conf.xml
/testInput/job_2.jhist
/testInput/job_2_conf.xml
JobHistoryFileReplay 测试的示例输出
TRANSACTION RATE (per mapper): 4000.0 ops/s
IO RATE (per mapper): 0.0 KB/s
TRANSACTION RATE (total): 8000.0 ops/s
IO RATE (total): 0.0 KB/s